Bow-Tie Analysis
Path: /bow-tie
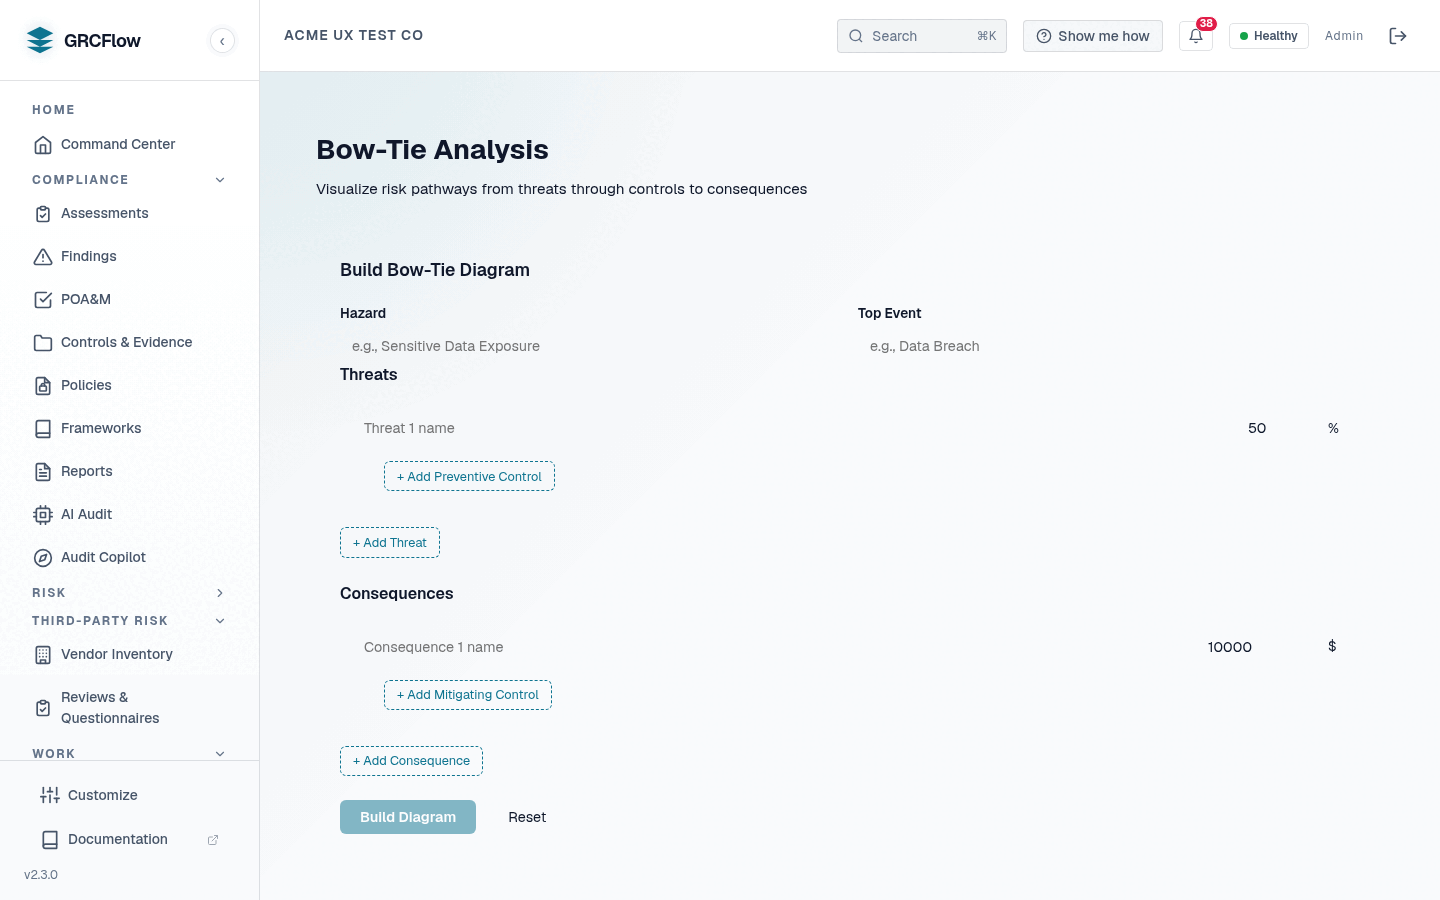
Visual bow-tie risk analysis connecting threats, controls, and consequences. Useful for understanding control effectiveness and identifying gaps.
Client-side scratchpad — diagrams are not saved
Bow-Tie Analysis is a browser-side diagram builder. There is no backend endpoint, no database table, and no persistence of any kind — the diagrams you build live in the page's memory and are gone as soon as you reload or navigate away. There is no export or download either, so screenshot the diagram if you need to keep it, and record the resulting risk in the Risk Register, which is persisted. Because it stores nothing, the page ships hidden by default — re-enable it from the sidebar's Customize popover.
How It Works
- Left side (Threats) — What could go wrong.
- Center (Event) — The risk event you're analyzing.
- Preventive controls — Controls that reduce the likelihood of the event.
- Mitigating controls — Controls that reduce the impact if the event occurs.
- Right side (Consequences) — Potential outcomes if the event occurs.