Risk Quantification (FAIR)
Path: /risk-quantification
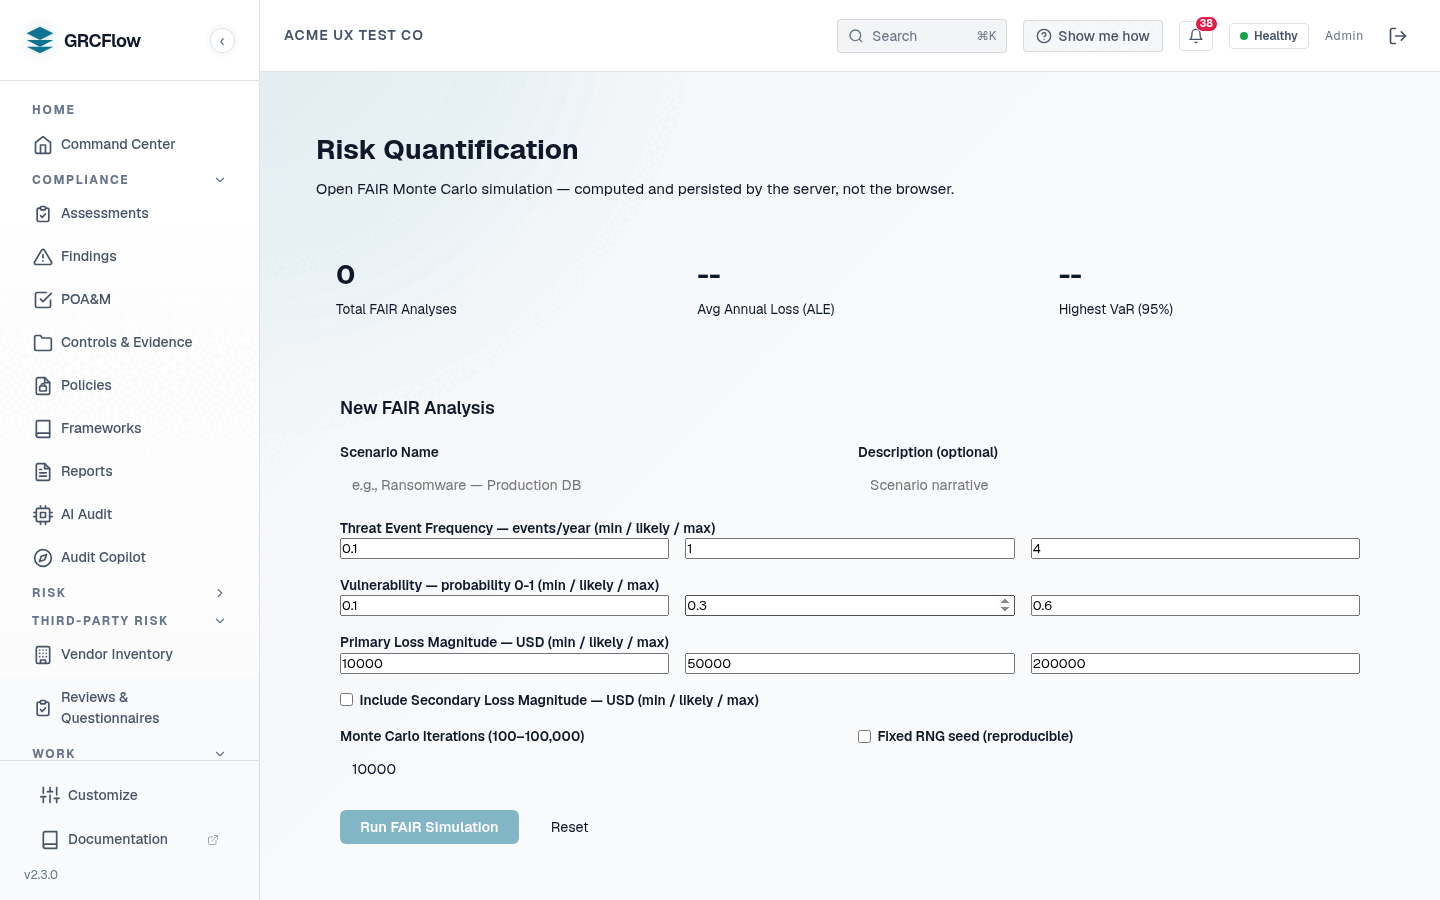
FAIR (Factor Analysis of Information Risk) methodology for quantifying risks in financial terms. The page drives the server-side Open FAIR Monte Carlo engine — every analysis is executed and persisted by the backend, and the results you see are the engine's real output (there is no client-side simulation).
Inputs
Parameters use PERT (min / most-likely / max) distributions:
- TEF — Threat Event Frequency (events per year)
- Vulnerability — probability a threat event becomes a loss event (0–1)
- PLM — Primary Loss Magnitude (USD per event)
- SLM — Secondary Loss Magnitude (optional)
- Iterations — 100 to 100,000 Monte Carlo iterations
- Random seed — optional, for reproducible runs
Outputs
- ALE — Annualized Loss Expectancy (mean, median, std dev, min/max)
- VaR — Value at Risk at the 90th / 95th / 99th percentiles
- Loss distribution histogram
- Loss exceedance curve — probability of exceeding each loss threshold
API
POST   /api/v1/orgs/{org_id}/risks/fair                 # run + persist an analysis
GET    /api/v1/orgs/{org_id}/risks/fair                 # list analyses (filter by risk entry / status)
GET    /api/v1/orgs/{org_id}/risks/fair/{analysis_id}   # full results
PATCH  /api/v1/orgs/{org_id}/risks/fair/{analysis_id}   # update metadata
DELETE /api/v1/orgs/{org_id}/risks/fair/{analysis_id}   # delete
POST   /api/v1/orgs/{org_id}/risks/fair/portfolio       # portfolio VaR across selected analyses
Portfolio Value at Risk
POST .../risks/fair/portfolio aggregates several analyses into a single
portfolio-level loss distribution: each iteration re-samples every scenario's
PERT parameters and sums the losses, so the returned mean ALE and VaR
90 / 95 / 99 reflect combined exposure rather than the sum of independent
percentiles. Only analyses belonging to your organization that are in
completed status are included.
An analysis can be tied to a risk register entry via
risk_entry_id. Completed simulations are the only source of the FAIR ALE
figures shown in the board pack report — a risk without a
completed simulation shows no ALE rather than a fabricated one.
How to Run a Risk Analysis
- Click New Analysis and give it a title (optionally link a risk register entry).
- Set TEF, Vulnerability, and loss-magnitude PERT parameters.
- Choose the iteration count (and a seed if you need reproducibility).
- Run. The server executes the simulation, persists it, and renders the ALE, VaR table, histogram, and loss-exceedance curve. Failed runs surface the server's error — never a fake result.